

Profit & Loss
The Profit & Loss report (the income statement) answers the simplest question in the business: across this period, did the shop make money? Revenue minus the cost of what you sold minus what you spent running the place, all the way down to one signed number at the bottom.
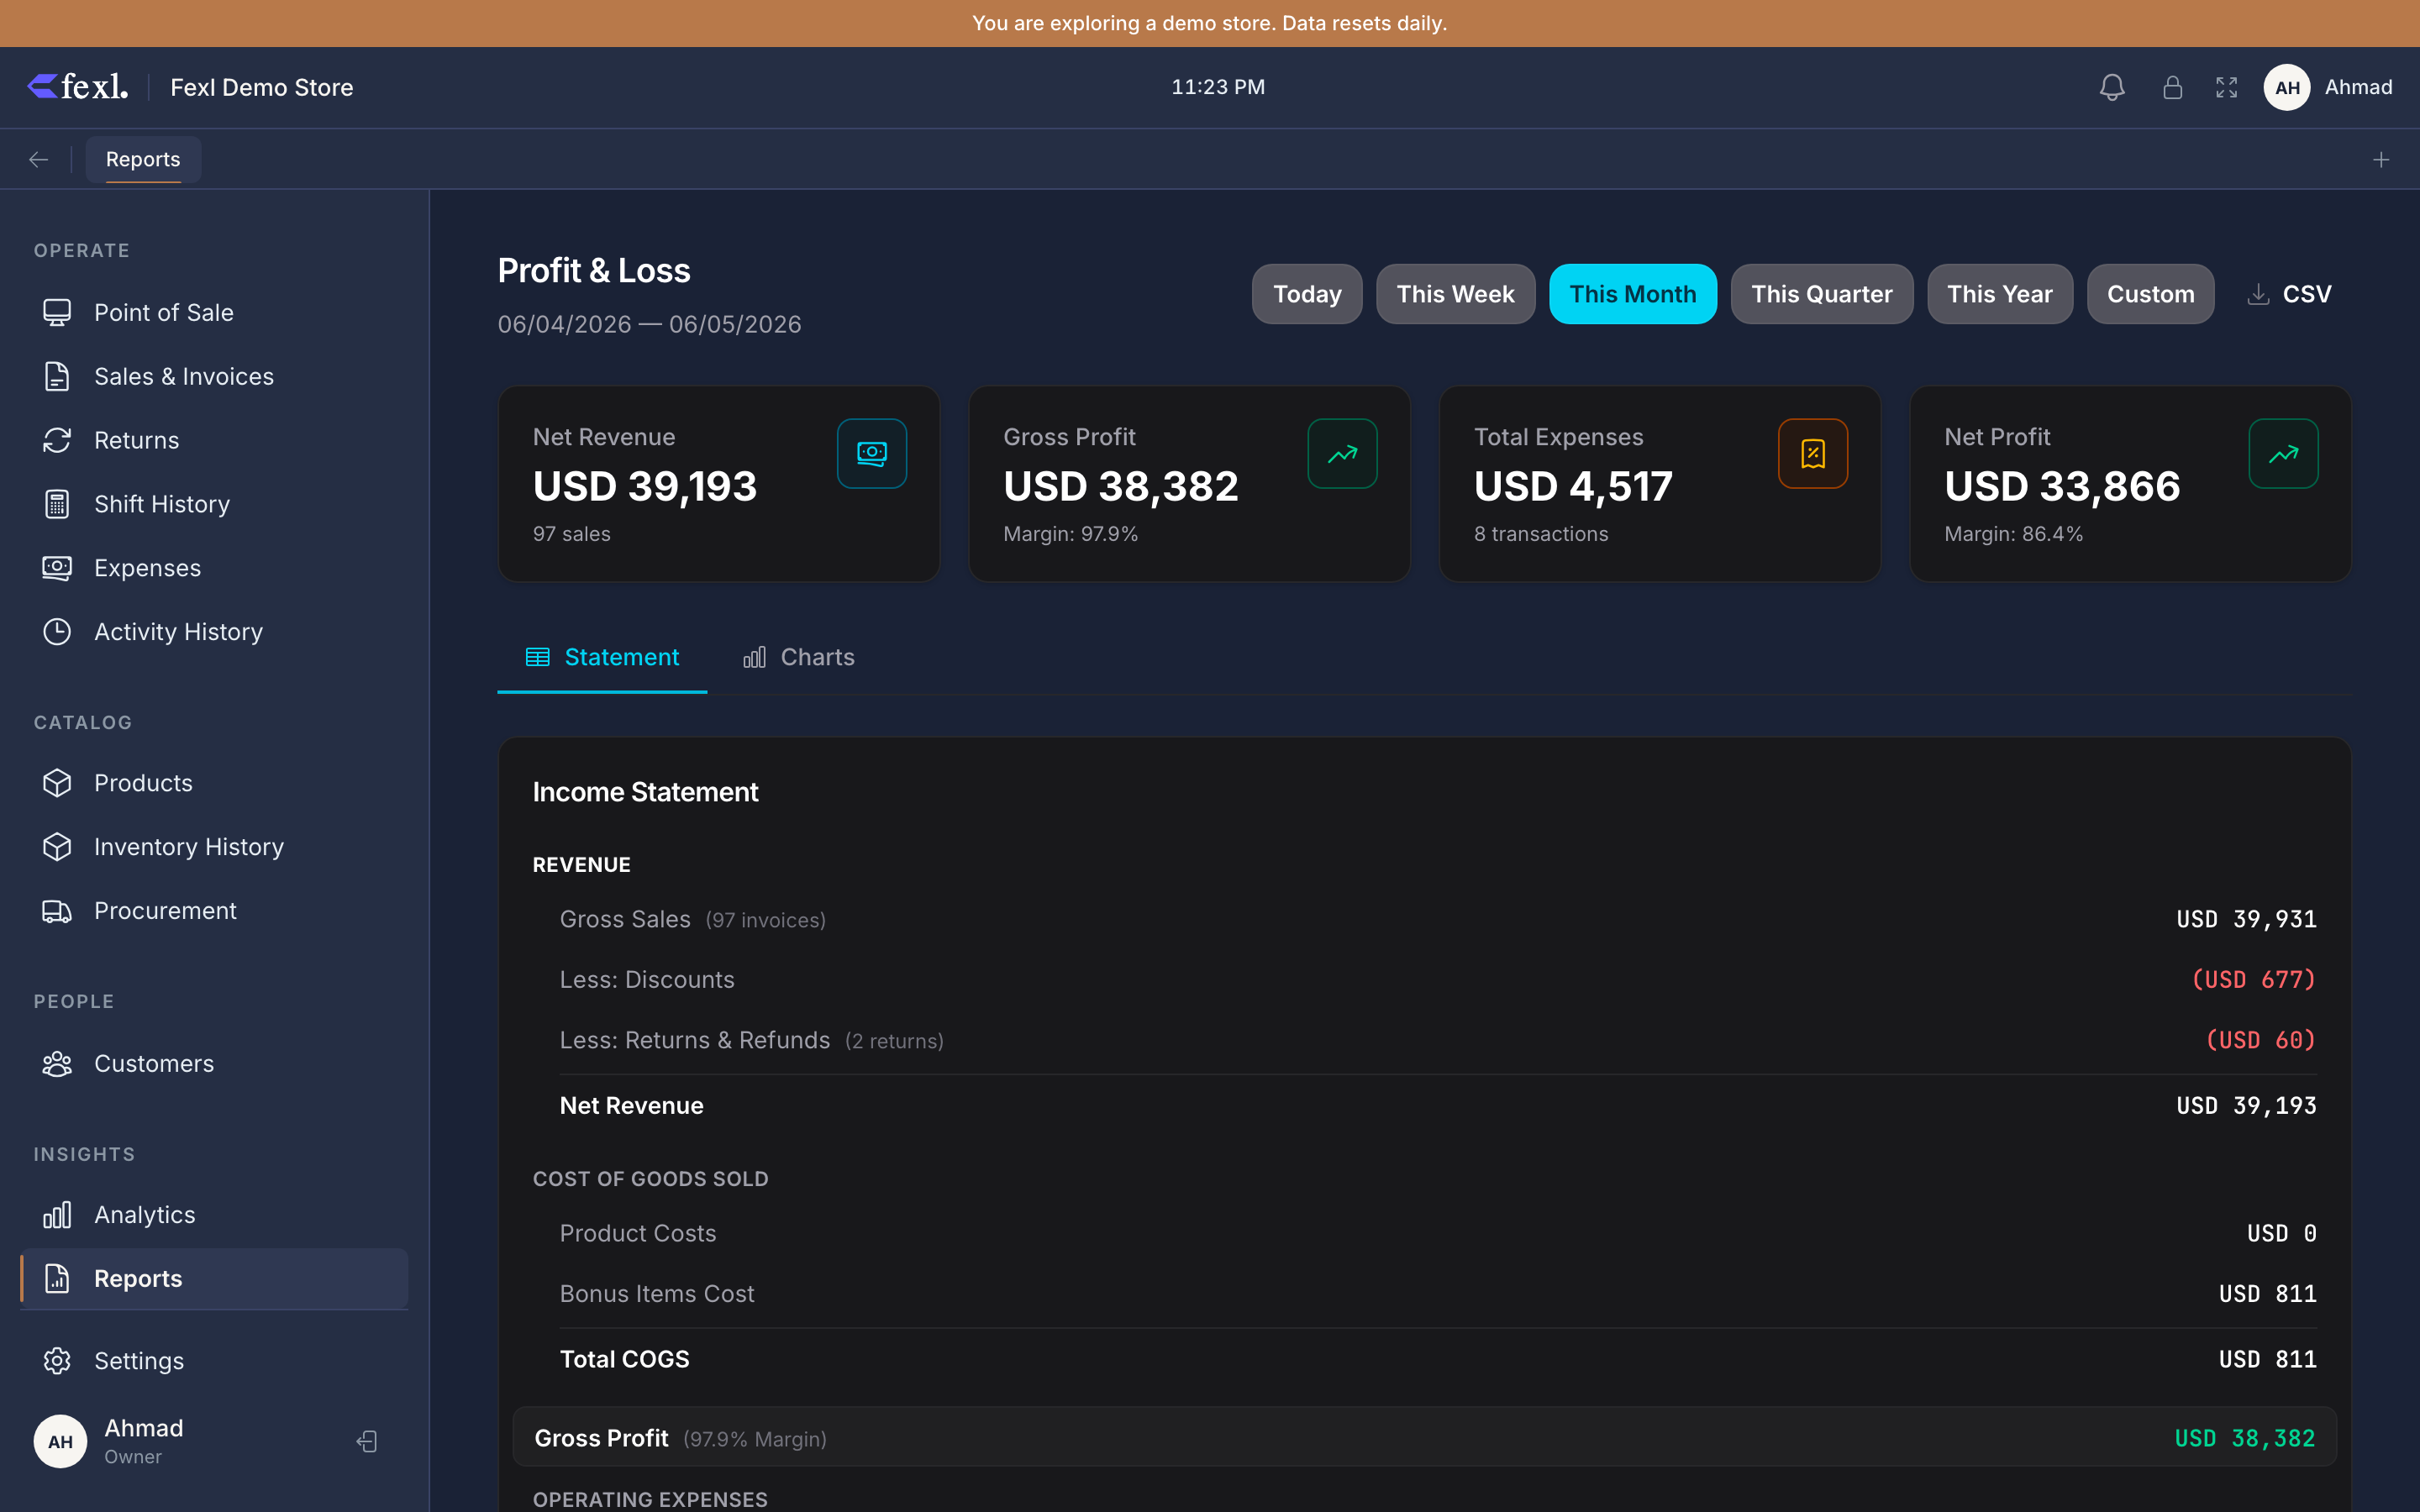
What’s on the report
The statement is laid out in the order an accountant expects: revenue at the top, costs of those sales next, gross profit on its own line, operating expenses below, net profit at the bottom. The KPI cards along the header (Net Revenue, Gross Profit, Total Expenses, Net Profit) summarise the same numbers — they are not a separate calculation.
Revenue
Sales recognised in the period. Cancelled invoices and comp invoices are excluded — comps intentionally post no journal entries, so including them would inflate revenue against an empty cash side.
- Gross Sales — sum of
totalon every non-cancelled, non-comp invoice in range. The Sales Revenue account (4010) on the Trial Balance reconciles to this number minus VAT. - Less Discounts — line discounts and order-level discounts that were applied at checkout, shown as a negative contra row.
- Less Returns & Refunds — refund totals from completed customer returns in the period. (This is sourced from the
returnstable, not a separate contra-revenue account in the chart of accounts; the4020Sales Returns code exists for manual ledger entries.) - Net Revenue — gross sales minus discounts minus refunds. This is the number every margin percentage on the page is calculated against.
If deferred revenue is enabled, the Revenue block also splits gross sales into Recognised and Deferred. Most retail tenants leave this off and show one revenue number.
Cost of Goods Sold (COGS)
What the units you sold actually cost you to acquire — never the price you charged.
- Product Costs —
5010on the Trial Balance. Sum of the per-unit cost on every non-bonus egress audit row (inventory_transactions.type='egress',notes='Sale') inside the period. - Bonus Items Cost —
5020. The cost of free / BOGO units given away in the period, kept on its own line so promotional cost stays visible. - Total COGS — the two added together. Service products are excluded by design (no inventory cost basis), so a services-only tenant sees this line at zero.
Gross Profit
Net Revenue − Total COGS. The margin badge next to it (Gross Profit ÷ Net Revenue) is the cleanest health check on pricing — a falling gross margin while revenue rises usually means a vendor quietly raised prices and your sale prices haven’t caught up.
Operating Expenses
Everything else it costs to run the shop, grouped by category. Each row is one category from the chart of accounts (6010 Rent, 6020 Utilities, 6030 Transport, 6060 Marketing, through 6099 Other). Click a row to jump to the filtered Expenses page.
Delegate Commissions (6070) appears as its own line below the categories — it’s calculated from the delegate_commission field on each invoice, not the expense table, so it’s tracked separately even though the GL account is the same.
Net Profit
Gross Profit − Total Operating Expenses. The bottom line. Green when positive, red when negative; the margin next to it is Net Profit ÷ Net Revenue. A VAT memo sits below it if any VAT was collected — for information only, since VAT is a liability (2020), not revenue.
Picking a date range
The header buttons cover Today, This Week, This Month, This Quarter, This Year plus a Custom picker. The selected range is shown under the title, so a printed P&L always carries its own period stamp. Switching range refetches everything; numbers are recomputed live, never cached.
There is no “close the books” step. Re-running January’s P&L in June returns the same numbers it did in February, because the costs that ran through January’s COGS were captured on January’s invoices and never touched again. If a backdated edit lands (a refund applied to an old invoice, for example), the P&L reflects it — the report is faithful to whatever the ledger says today.
Where the COGS number comes from
This also means historical P&Ls only go as far back as your egress rows have correct costs. The v71 backfill in v1.6.100 walked every (tenant, product, variant) and rewrote historical egress costs FIFO-correctly; if you upgraded from an older build, the P&L for any period before the upgrade is now reconstructed from real layer history rather than the rolling product cost of the day.
Export and saving
The header has a CSV button that exports the statement as a flat list of label,amount rows in the same order they appear on the page — Gross Sales, Discounts, Returns, Net Sales, COGS, Gross Profit, expense categories, Total Operating Expenses, Net Profit. That CSV is the cleanest input for a spreadsheet handoff to an external accountant. There is also a Charts tab next to the statement view for the same data plotted as revenue-vs-expenses trend, expense breakdown pie, profit margin trend, top products, and revenue by payment method.
The Reports area is permission-gated — a user without the reports:view permission won’t see the section in the sidebar at all.
Related
- Balance Sheet — what you own and owe at a point in time
- Cash Flow — actual cash in vs cash out, the liquidity counterpart
- KPIs — top-line operational numbers in one view
- Inventory Valuation — open FIFO layers × cost
- FIFO costing — how the COGS line on this report is sourced