

Inventory Valuation
Inventory Valuation answers one question: how much is the stockroom worth, right now, at the cost we paid for it? Every unit on the shelf priced at its FIFO layer cost. The total reconciles to the 1200 Inventory line on the Balance Sheet — by design, since both numbers read from the same FIFO layer table.
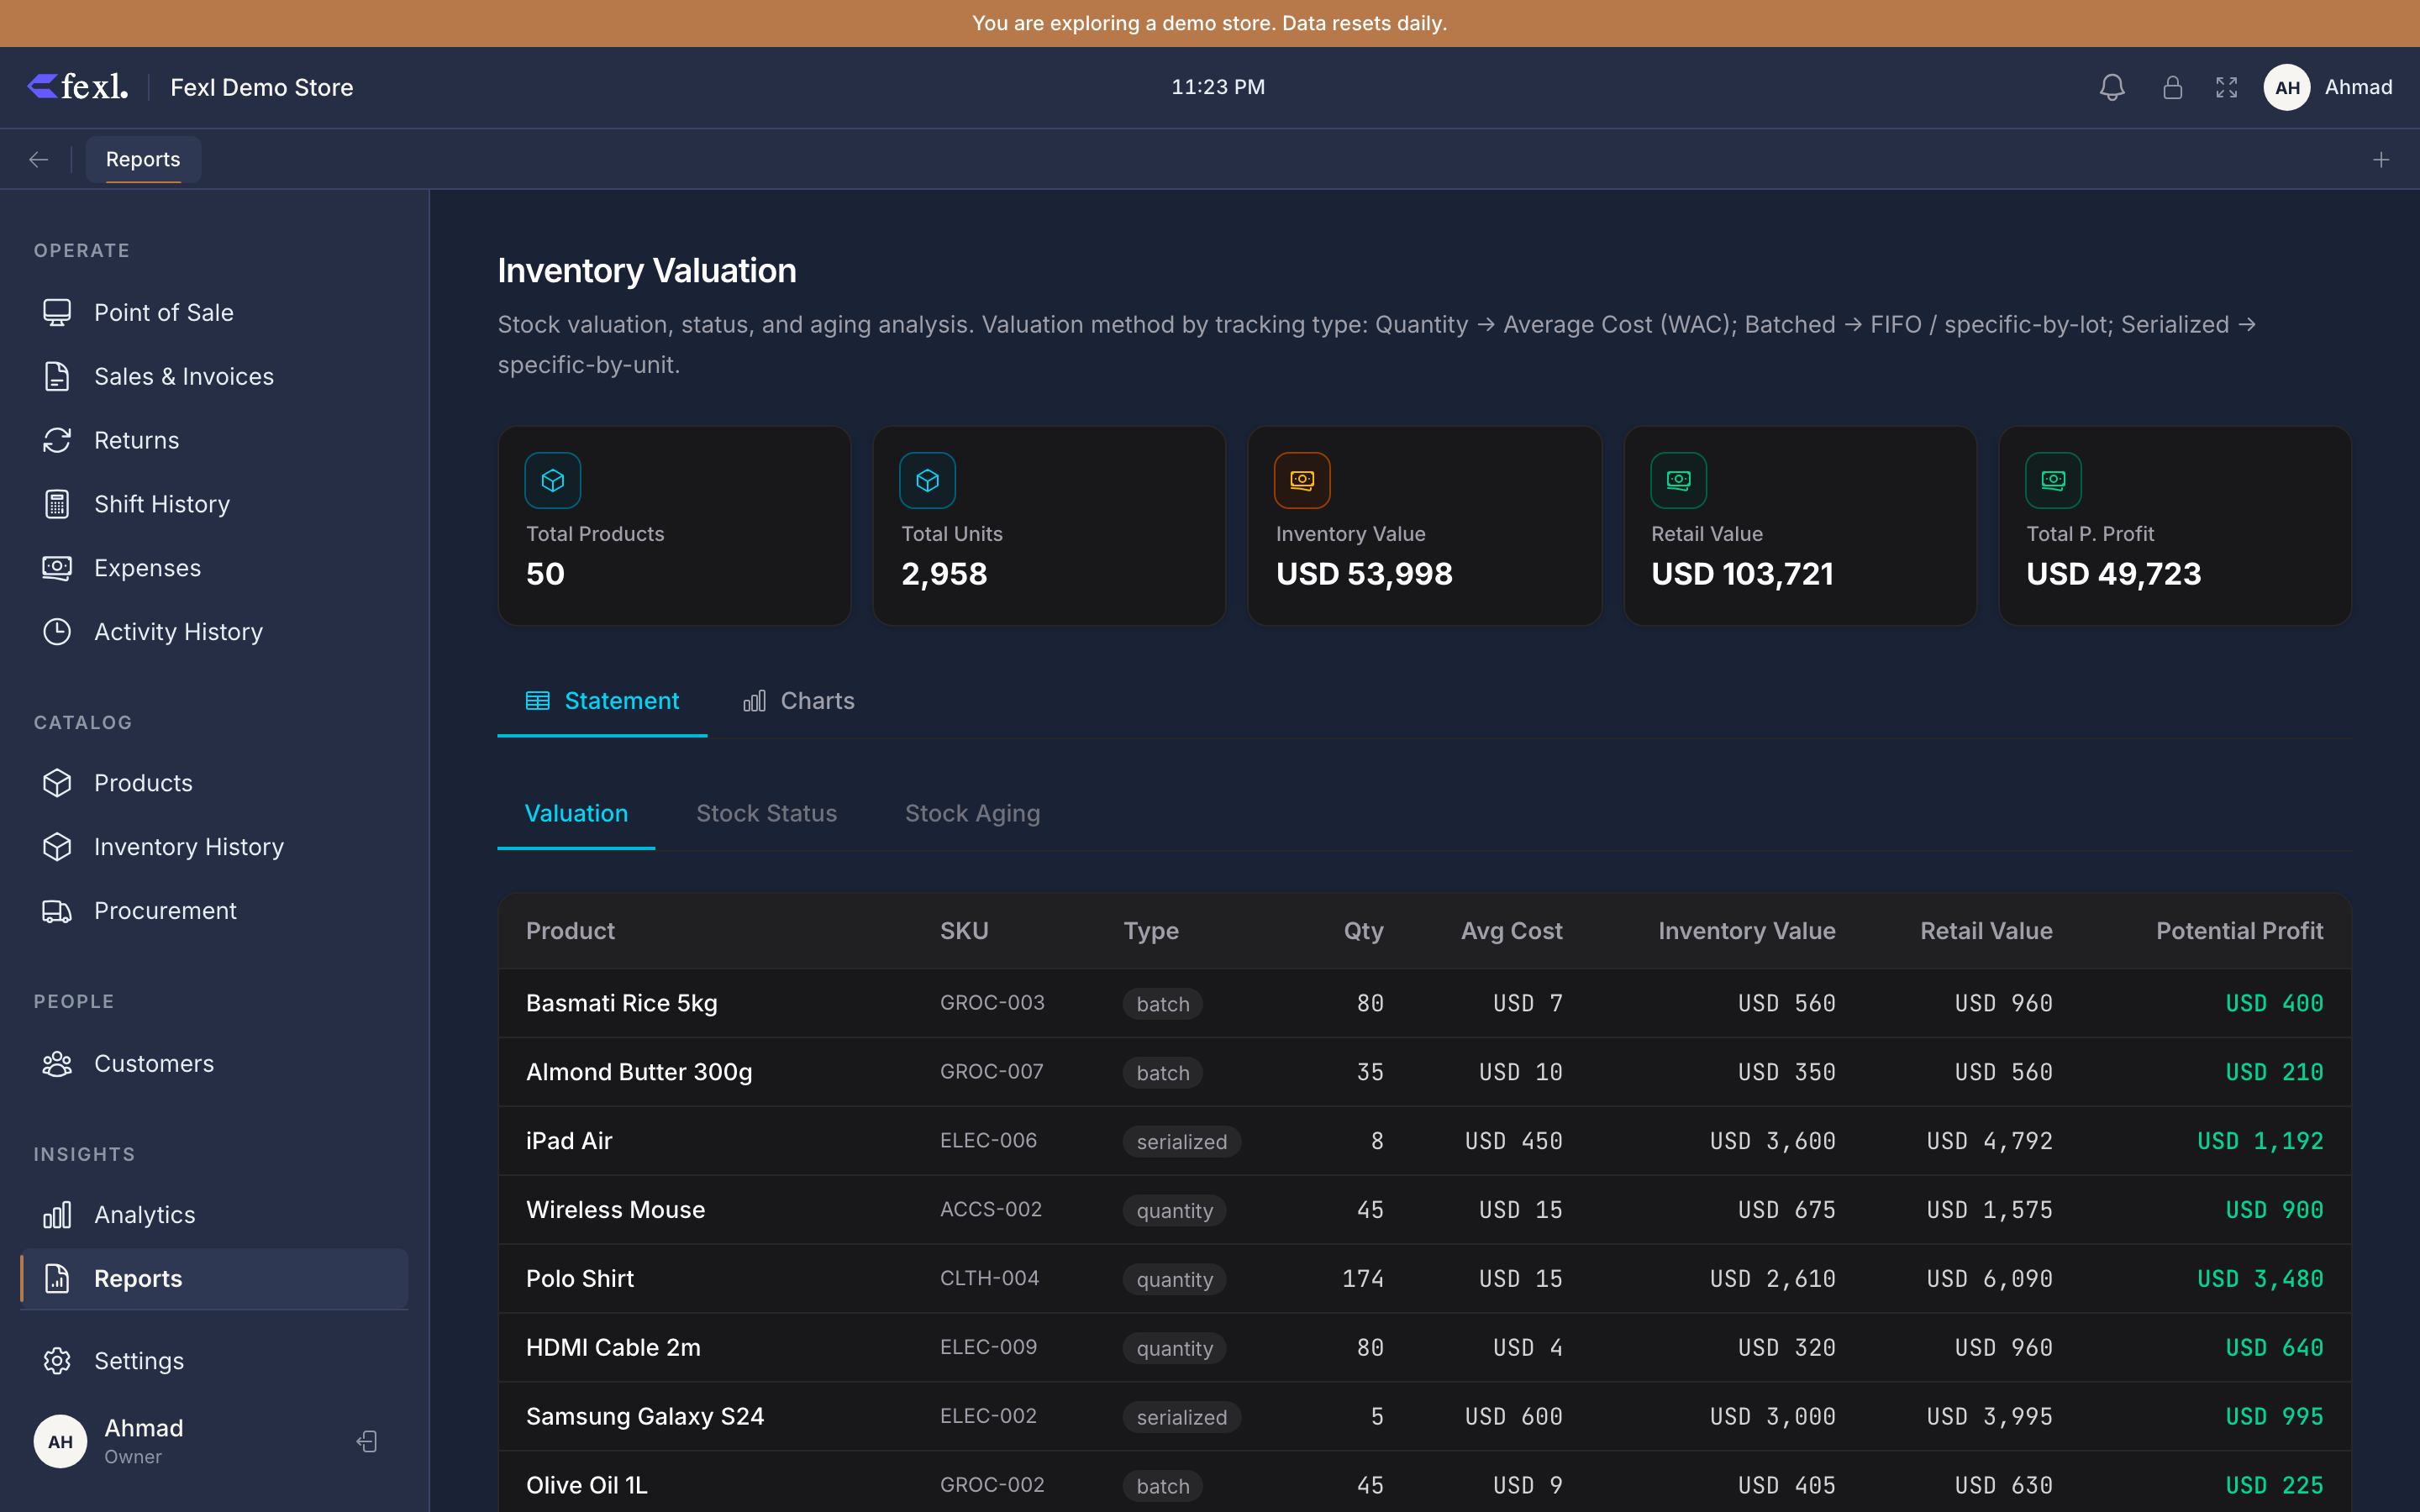
How each tracking mode is valued
Every product in Fexl Lite is one of three tracking modes, and the valuation rule per mode is different:
Quantity-tracked (default)
Most products. Stock value = Σ (qty_remaining × unit_cost) across every open ingress layer in inventory_transactions for the product. As units are sold, FIFO drains layers oldest-first, decrementing each layer’s qty_remaining. The valuation reads the surviving layers — that’s why a price increase on next month’s PO doesn’t retroactively bump this month’s valuation.
Batch-tracked
Lot-numbered, dated products. Stock value = Σ (batch.quantity × batch.unit_cost) across every batch with a non-zero quantity remaining. Each batch carries its own cost basis; the valuation report displays one row per (product × batch) when batch tracking is enabled, with the lot number and expiry visible.
Serialized
IMEI / serial-number-per-unit products. Stock value = Σ unit_cost across every serialized item with status='in_stock'. Each unit has its own cost stamped at restock. The report rolls these up to the parent product line by default; click the row to expand the per-serial detail.
The three tabs
- Valuation — the per-product table with quantity, FIFO unit cost, and total value. Sortable on every column. Default sort is total value descending — the biggest holdings at the top.
- Status — a breakdown of products into In Stock, Low Stock (at or below the per-product threshold), and Out of Stock. Counts and value per bucket. Useful for the weekly “what do we need to reorder?” pass.
- Aging — products by how long their oldest layer has been sitting. Buckets: 0-30 days, 31-60, 61-90, 91-180, 180+. The 180+ row is the slow-moving / dead-stock pile.
Filters
- Category — narrow to one product category. Summary card recomputes for the filtered set.
- Status — visible on the Status tab; filters the Valuation tab too when set.
- Search — filter by product name or SKU.
The summary cards at the top show Total Value, Total Products, Low Stock count, Out of Stock count.
Reconciling against the Balance Sheet
Service products
Products marked is_service=true have no inventory cost basis and don’t appear on this report. They post Service Revenue (4015) on sale but no COGS and no inventory move, so there’s nothing to value.
Bonus units
Bonus / BOGO units are valued at their per-unit cost the same way — they’re real inventory, just allocated to a promotion when sold. The valuation report doesn’t care whether a unit will be sold for full price or given away as a bonus; it values what’s on the shelf today.
Date logic
Inventory Valuation is point-in-time — there’s no date range picker, only an as-of date that defaults to now. Picking a past date asks “what was the stockroom worth on 31 March?” — the report walks the FIFO ledger forward to that date and stops, showing the layer state at that moment. Re-running the same as-of date later returns the same numbers, because the historical layers are immutable.
Export
The CSV button writes one row per product (or per batch / per serial when expanded) — name, SKU, category, quantity, unit cost, total value. The Aging and Status tabs each have their own export with the relevant columns.