

KPIs
The KPIs report is the at-a-glance dashboard for the period you pick — sales, profitability, inventory health, customers, suppliers, delegates — all in one screen. The numbers are deliberately small and headline-only; the source-of-truth detail for any of them is one click away in the deeper financial and operational reports.
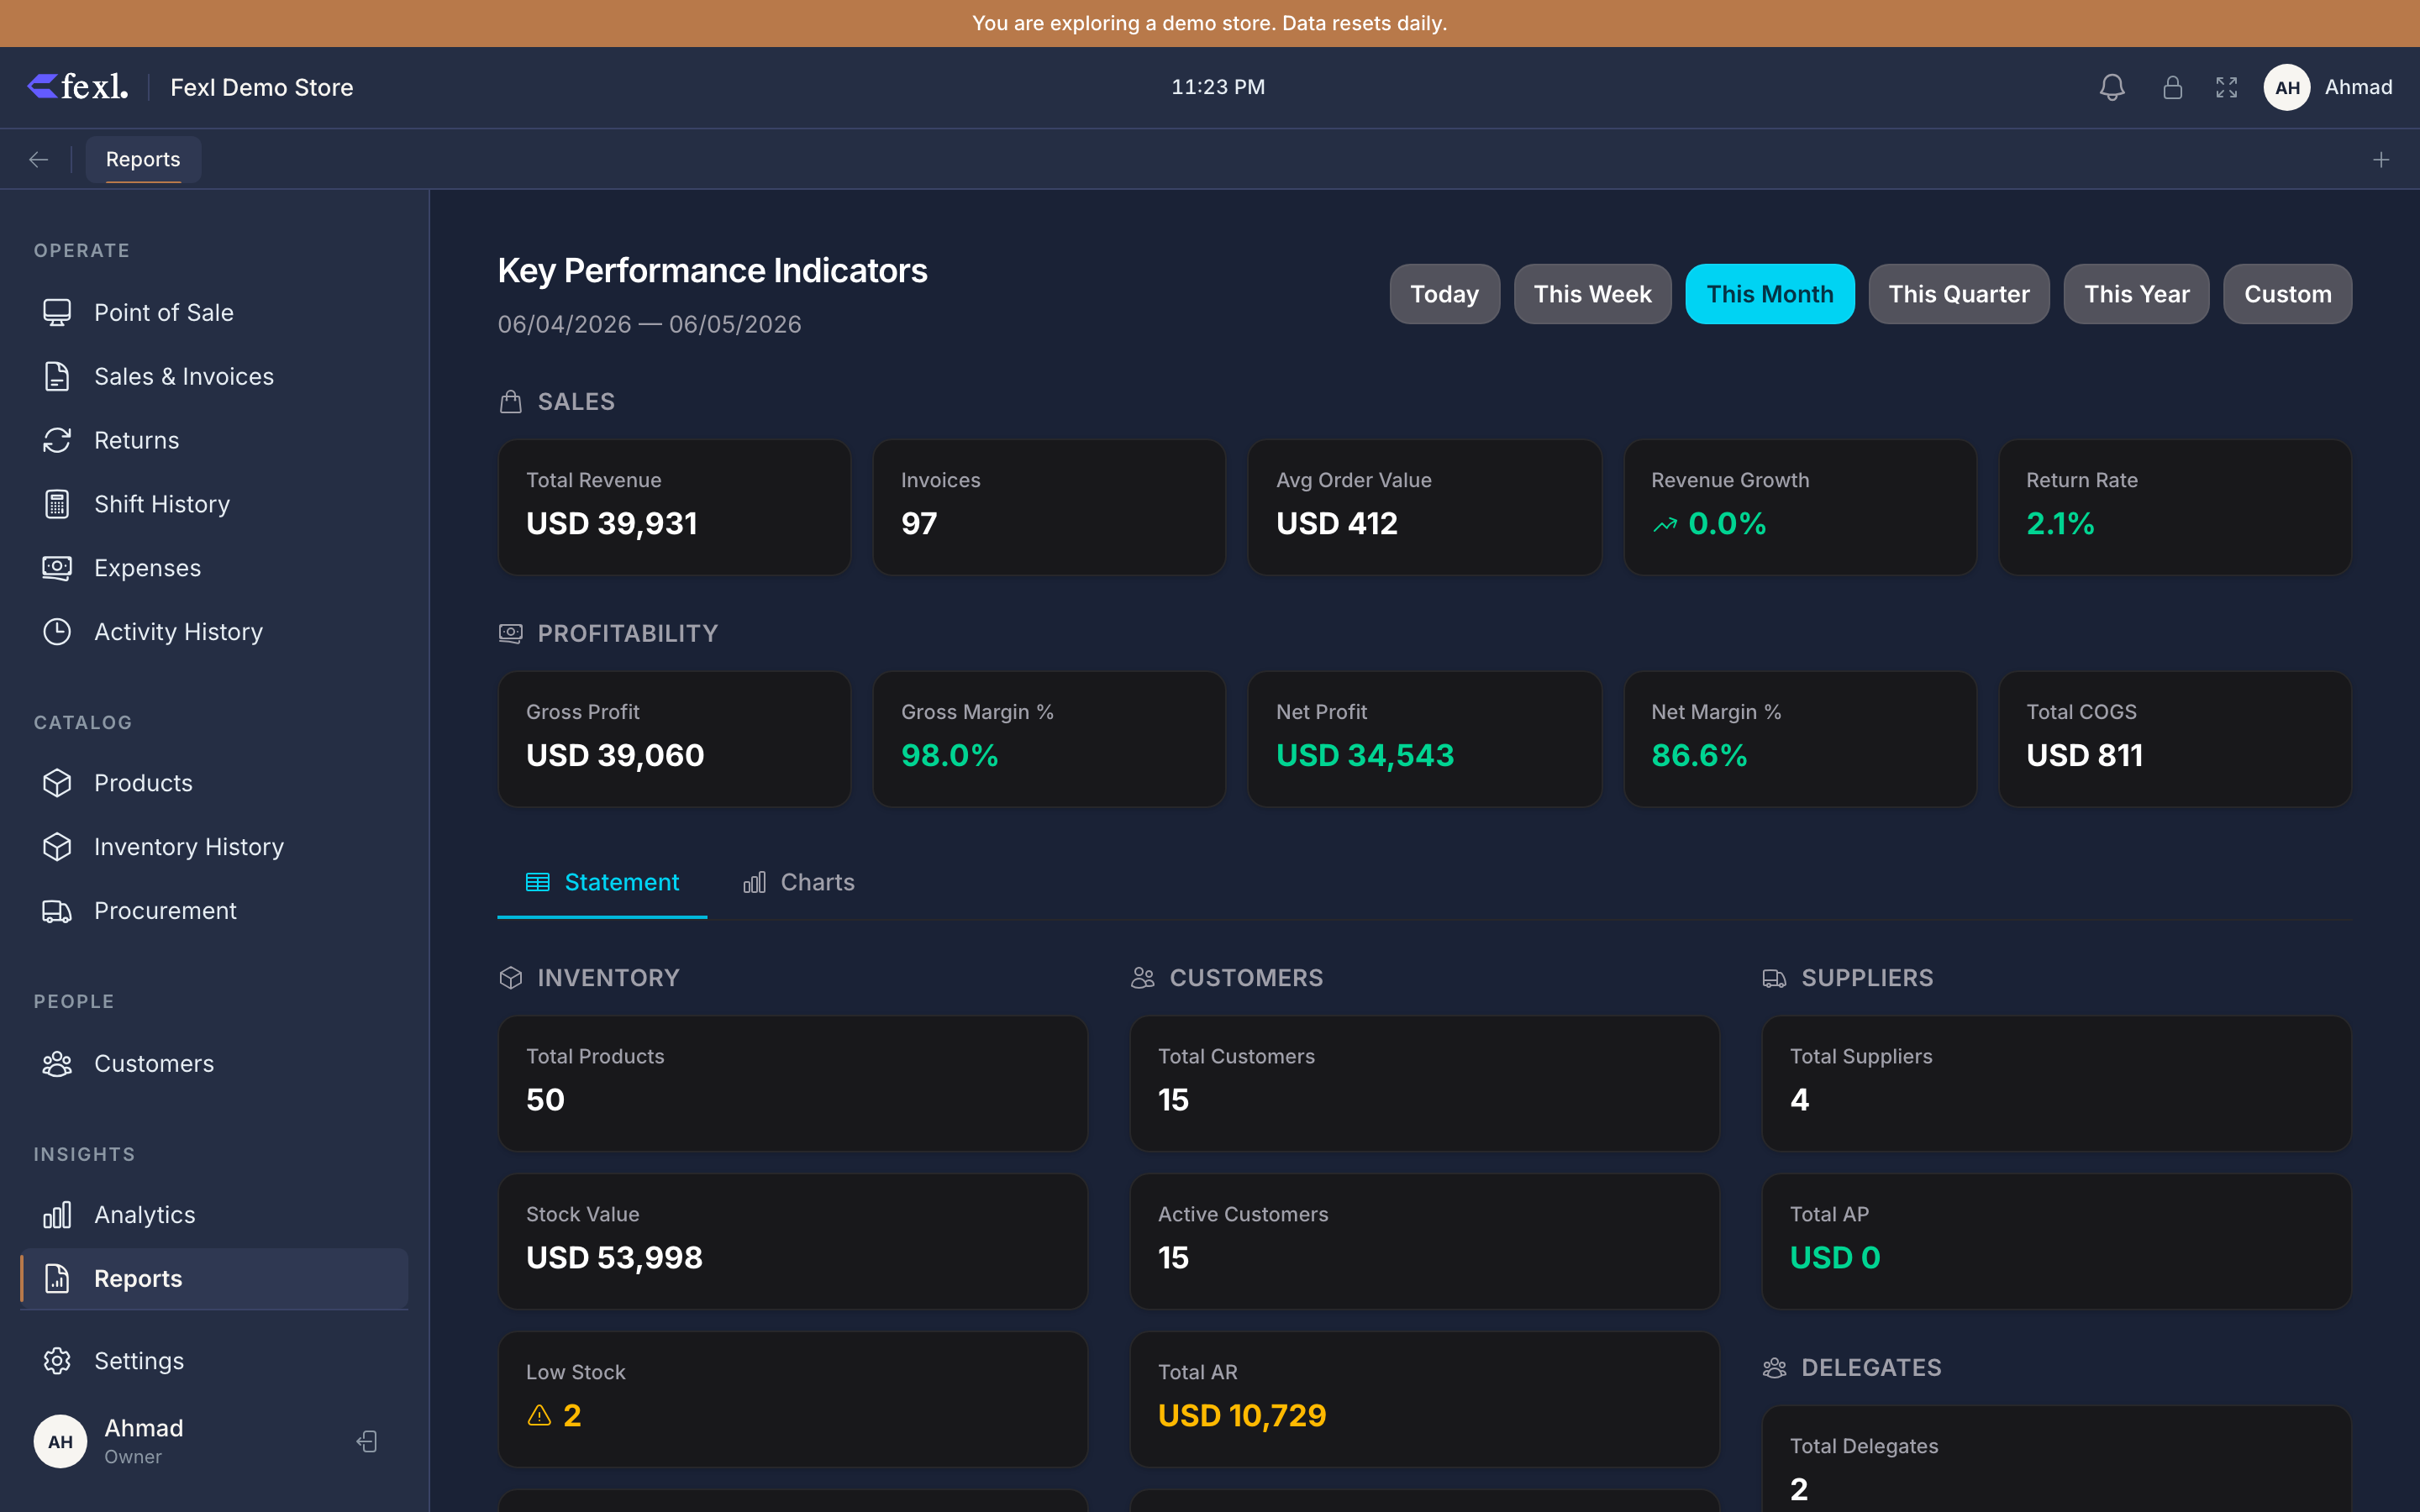
The headline metrics
Every KPI on this page is recomputed live from the same tables your other reports read, so the numbers reconcile. Cancelled invoices and comp invoices are excluded everywhere — comps intentionally have no journal entries, so counting them here would inflate revenue without a matching ledger row.
Sales KPIs
- Total Revenue — sum of
invoices.totalfor non-cancelled, non-comp invoices in the range. This is gross — returns are subtracted only later, in the profitability block. - Invoice Count — how many invoices were rung. Drives the average ticket below.
- Avg. Order Value —
total_revenue / invoice_count, the average ticket size. - Revenue Growth — percentage change vs the immediately preceding period of the same length. A green up-arrow means up, red down-arrow means down. Hidden as 0% if there’s no prior-period data to compare against.
- Return Rate — completed customer returns in the period divided by invoice count, as a percentage. Badge flips amber above 5% and red above 10%.
Profitability KPIs
- Gross Profit — net sales (revenue minus refunds) minus COGS.
- Gross Margin % — gross profit divided by net sales. Green when 30% or more, amber otherwise.
- Net Profit — gross profit minus expenses minus delegate commissions. Red when negative.
- Net Margin % — net profit divided by net sales. Green at 10%+, amber otherwise.
- Total COGS — cost-of-goods sold for the period, summed per-line at FIFO unit cost. Service products contribute zero COGS by design (so this number matches GL account 5010 and the Profit & Loss report).
Inventory KPIs
- Total Products — count of active product lines.
- Stock Value — every unit on hand priced at its FIFO cost. Pulls from the inventory table for quantity-tracked products, plus per-unit rows for serialized items and per-batch quantities for batch-tracked products. No double-counting.
- Low Stock — products at or below their per-product low-stock threshold. Amber badge when above zero.
- Out of Stock — products with zero on-hand. Red badge when above zero.
- Inventory Turnover — COGS divided by stock value. How many times the stockroom flipped over in the period.
- Days of Inventory —
stock_value / cogs × 365. How many days of cover the current stock level represents at the period’s burn rate.
Customers, Suppliers, Delegates
- Total Customers / Active Customers — total on file vs. distinct customers who actually bought something in the period.
- Total AR — sum of outstanding
amount_owedacross non-cancelled invoices. Pay-later debt and pending COD both contribute here. - Avg. Customer Value — total revenue divided by active-customer count.
- Total Suppliers / Total AP — counterparty count and outstanding payable balance (owed minus paid against supplier_payments).
- Total Delegates / Total Commissions — number of delegates and commissions accrued in the period.
- Top Delegate — highest-grossing delegate in the period, with their total sales as the subtitle.
The Charts tab on the same page renders two visuals on the same data: a revenue-trend area chart (one point per day) and a top-categories pie chart (top six categories by revenue, with a coloured legend listing each).
Date range and comparisons
Five preset buttons sit across the top — Today, This Week, This Month (the default), This Quarter, This Year — plus a Custom option that reveals two date inputs. Whichever is active recomputes every card on the page and the trend chart underneath.
The Revenue Growth card is the only one that compares against a second window: it queries the same-length window immediately preceding your selection. Pick “This Month” and you’re comparing to last month; pick a custom 14-day range and you’re comparing to the 14 days before that.
The business-day start hour from your tenant settings is honoured for the “Today” preset, so a 03:00 sale rung on a 06:00-start day still counts toward yesterday — matching the rest of the reporting suite.
Related
- Profit & Loss — full P&L behind the gross/net profit cards
- Balance Sheet — AR, AP, and stock value as a snapshot
- General Ledger — every journal line backing the P&L numbers
- Inventory Valuation — per-product FIFO breakdown
- Cash Drawer Report — daily cash reconciliation