

Reports — see what's actually happening in your store
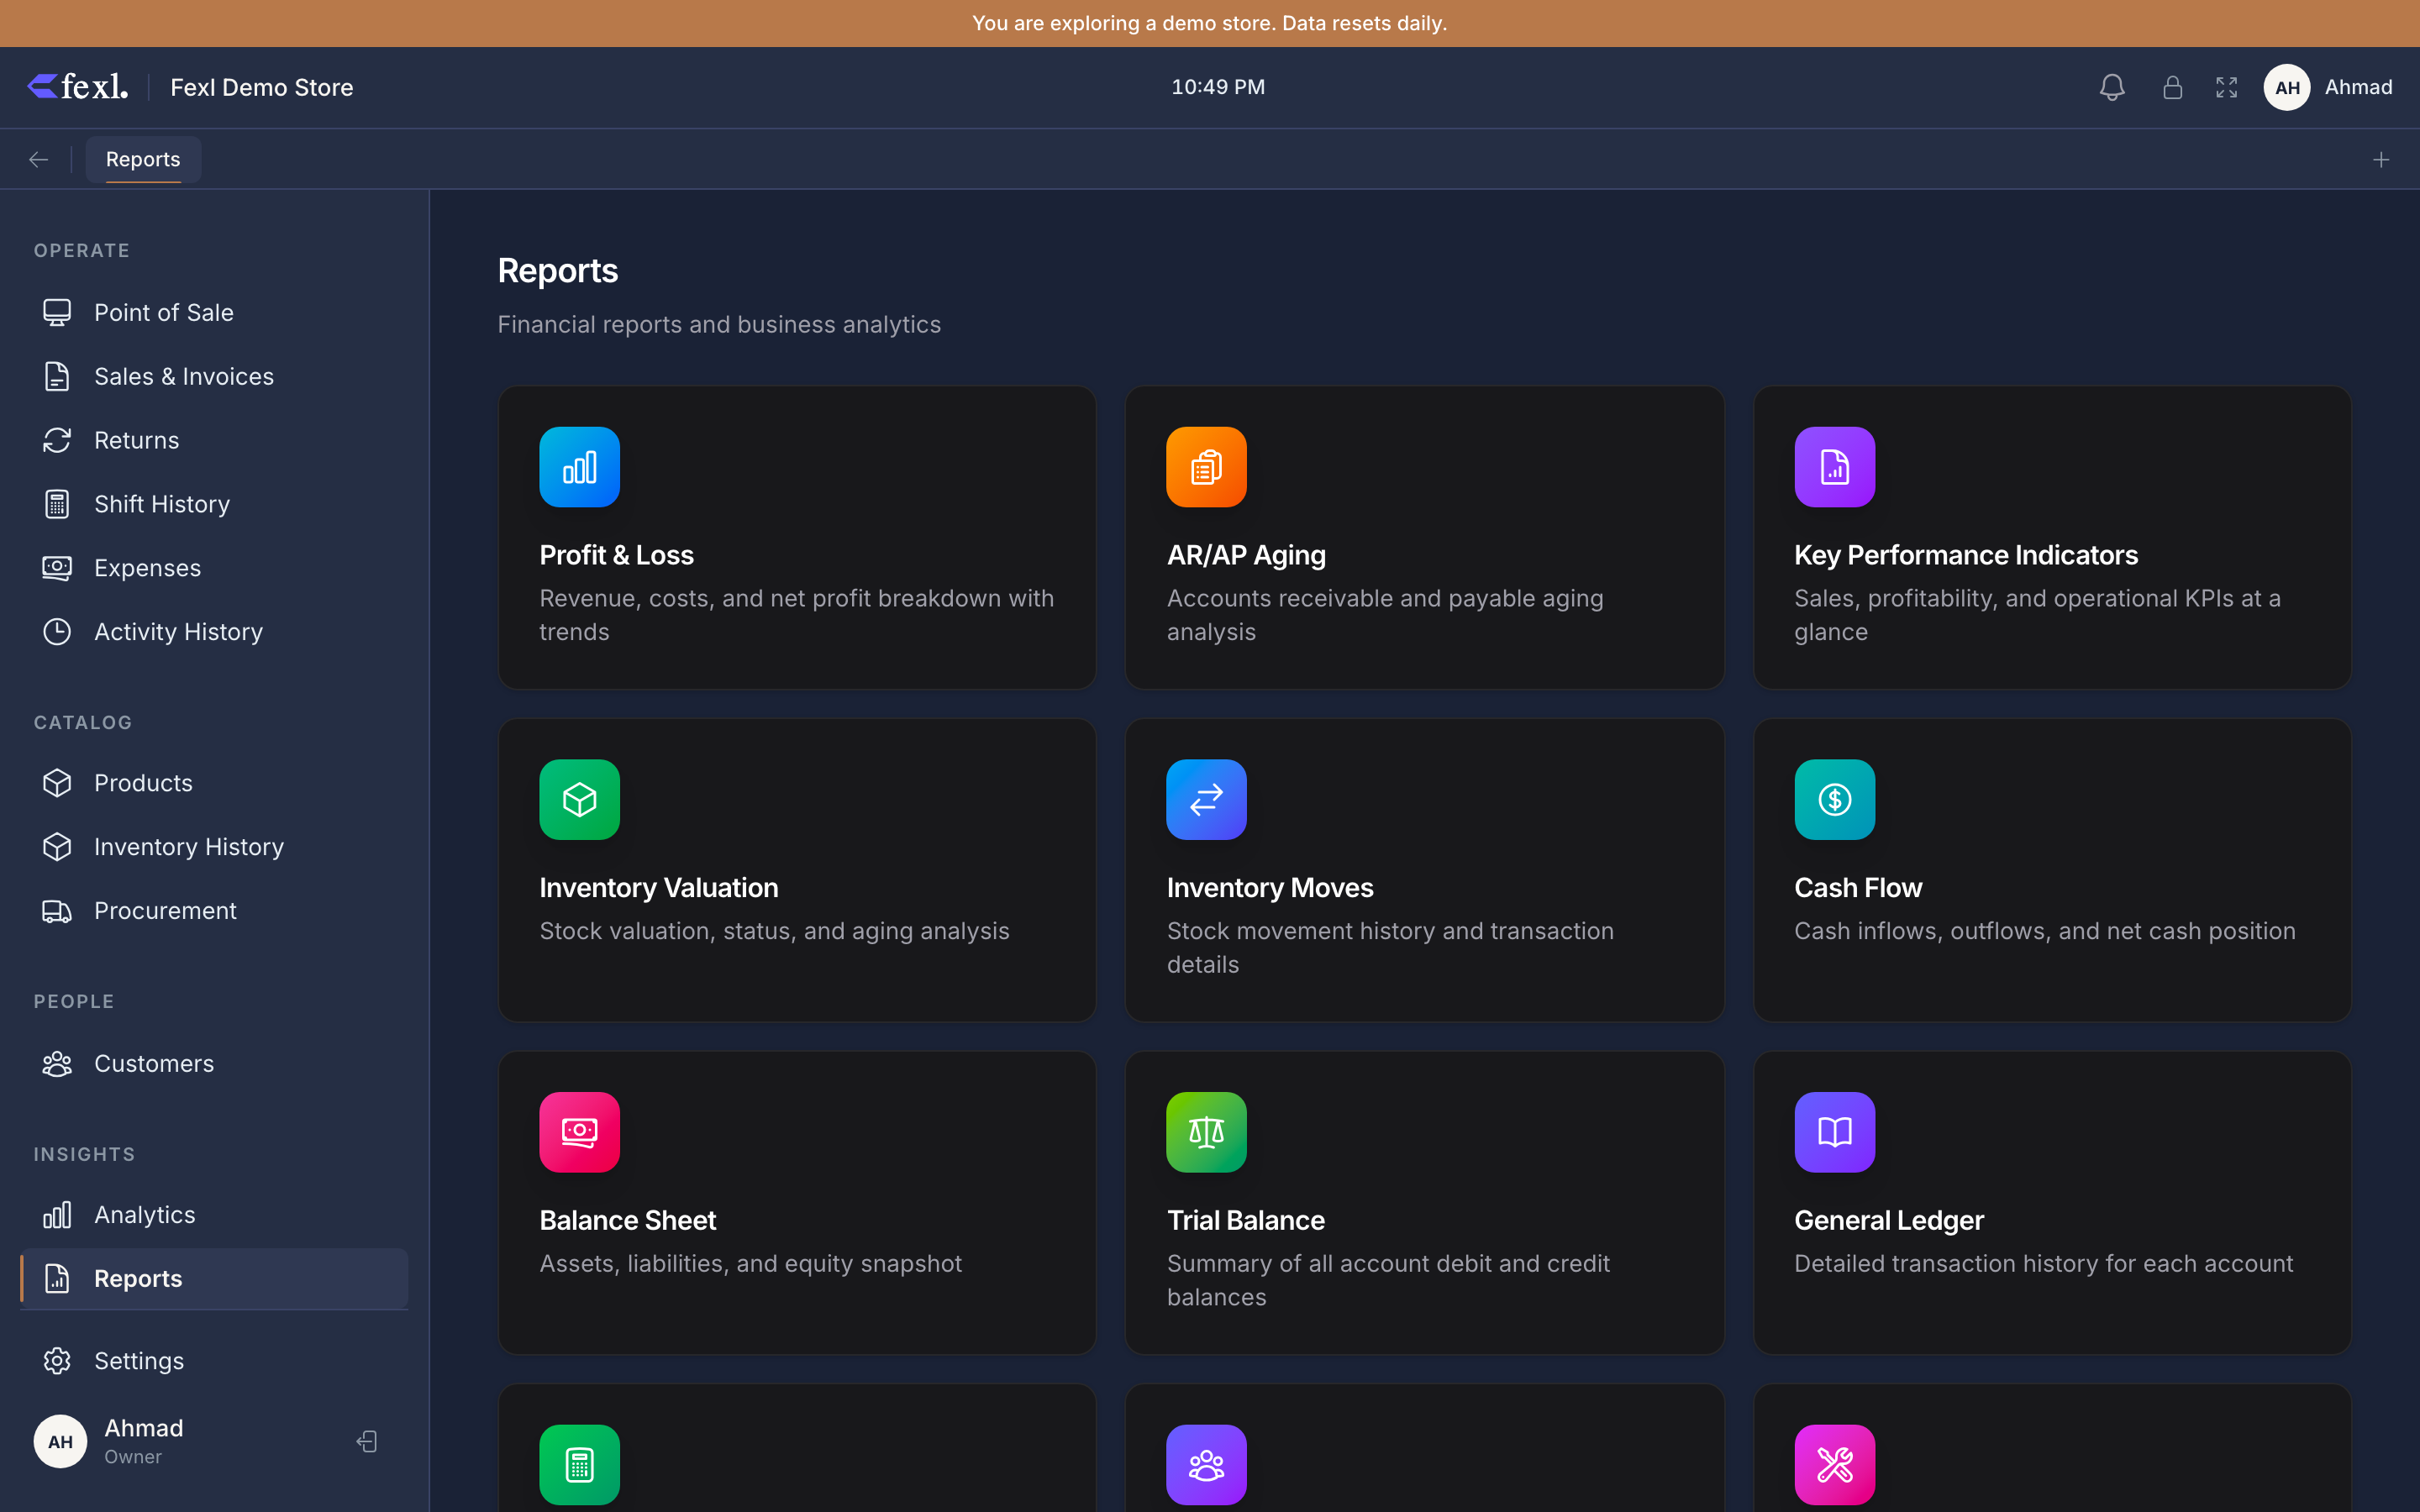
The Dashboard is the at-a-glance pulse of the store. Reports are the source of truth: twelve of them, all reading the same journal that POS, returns, and expenses post into, so the books on screen are the books in the database. This page is the map — what each report answers and which one to open first.
The financials (4 reports)
These are the four an accountant will ask for first. They cover the same period from four angles — earnings, position, cash, and headline numbers — and they all reconcile against the same journal entries.
- Profit & Loss — revenue, COGS, gross margin, operating expenses, net income for the chosen period. Stat cards on top, full statement below, charts tab next to the table.
- Balance Sheet — assets, liabilities, equity at a point in time. Drilldown dialog on every account row to see who posted what. #56 v1.6.100 Cash on the asset side is now derived from the sum of cash sub-accounts (no more double-counting when a transfer is mid-flight).
- Cash Flow — operating, investing, financing inflows and outflows over the period. Shows the cash position the way the business actually feels it, not the way accrual accounting reports it.
- KPIs — revenue, transactions, average basket, top product, top delegate, growth vs the previous period of the same length. The one to open if you only have thirty seconds.
Operations (5 reports)
The day-to-day reports — what’s on the shelf, who owes whom, who did what at the till.
- Inventory Valuation — every product priced at its FIFO cost layer for an exact stockroom value. Tabs for valuation, status (in/low/out), and aging.
- Inventory Moves — every ingress, egress, and adjustment over a date range, filterable by direction. #67 v1.6.100 The source column now emits a readable label instead of the raw enum.
- AR/AP Aging — customer debt and supplier balances bucketed by age (current, 1-30, 31-60, 61-90, 90+). Two tabs: AR for what customers owe you, AP for what you owe suppliers.
- Cash Drawer Report — shifts, cash transactions, variances, by user and date. The auditor’s first stop when a number doesn’t add up at end of day.
- User Activity — every action by every user — sales, refunds, expenses, stock adjustments, debt collections — in one filterable log. Excel export, not just CSV.
Bookkeeping (3 reports)
The accountant’s tools. You’ll touch these less often, but when you need them you really need them.
- General Ledger — every journal entry line, grouped by account, drillable to the source document (invoice, expense, return, debt payment). #55 v1.6.100 Repeated date and entry number on consecutive lines of the same JE are now suppressed, so a multi-line entry reads as one block instead of a wall.
- Trial Balance — debits and credits per account, with a green check or amber warning at the top depending on whether the books balance. The cheapest invariant check in the system.
- Custom Reports — four tabs: pick a template, build a query, pivot the result, or assemble a dashboard. The escape hatch when the eleven canned reports don’t ask the question you need to ask.
All twelve reports
Profit & Loss
Revenue, COGS, expenses, net income for any period. The headline financial.
Balance Sheet
Assets, liabilities, equity at a moment in time. Click any row to drill down.
Cash Flow
Operating, investing, financing flows. The view that matches your bank statement.
Key Performance Indicators
Revenue, basket, growth, top product, top delegate. Thirty-second pulse check.
Inventory Valuation
Stockroom worth at FIFO. Status and aging tabs alongside.
Inventory Moves
Every ingress and egress over a date range, by direction.
AR / AP Aging
Customer debt and supplier balance, bucketed by age.
Cash Drawer Report
Shifts, transactions, variances, by user.
User Activity
Every action by every user. Excel export.
General Ledger
Every journal entry line, drillable to the source.
Trial Balance
Debits and credits per account, with a balance check.
Custom Reports
Templates, query builder, pivot tables, dashboards.
Date ranges and exports
Every dated report runs the same range picker — Today, Week, Month, Quarter, Year, or a custom start and end date. The day boundary respects the Business Day Start Hour in Settings, so a store that closes at 2 a.m. doesn’t slice its evening across two reporting days. Balance Sheet and Inventory Valuation are point-in-time and don’t take a range.
CSV export is on the financials, the Trial Balance, and most operational reports. The User Activity report exports to Excel (.xlsx) instead, so columns keep their types and the file opens directly in the accountant’s spreadsheet without an import step.
Related
- The Dashboard — the at-a-glance counterpart to this section
- Chart of Accounts — the account codes every report rolls up to
- Journal entries explained — what the GL is showing you
- Release notes — bug-fix history for v1.6.100 (#55, #56, #67) and earlier